Order Blocks Simplified — How Institutions Control Price🔥 Order Blocks Simplified — How Institutions Control Price
Order Blocks are one of the most important concepts in modern trading — because they show where institutions place REAL positions, not where retail traders guess. 🏦📊
When you understand Order Blocks, you stop chasing random candles and start reading the footprints of smart money. Let’s simplify it. 👇✨
📌 What Is an Order Block? 🧱💰
An Order Block (OB) is a price zone where big institutions (banks, hedge funds, market makers) place massive orders.
These zones often appear before strong market moves — because that’s where smart money builds positions.
Think of an Order Block as:
🔹 The origin of a powerful move
🔹 A zone where price reacts repeatedly
🔹 A region that creates imbalance and momentum
🔹 A point where institutional orders remain unfilled
Once price returns to that zone, institutions fill the rest of their orders, causing another strong reaction. ⚡📈📉
📌 Why Do Order Blocks Matter? 🧠🔥
Because institutions control 80%+ of market volume — not retail.
So when they accumulate or distribute positions:
📈 Trends are born
📉 Reversals appear
🌊 Momentum shifts
💥 Big candles print
Order Blocks give you insight into:
✔️ Where big players enter
✔️ Where real support/resistance exists
✔️ Why price reverses at specific zones
✔️ Where high-probability trades form
It’s the closest thing to tracking the “big money blueprint.”
📌 How Order Blocks Form 🛠️📊
Order Blocks are created during periods of:
🔸 Accumulation (smart money buys quietly)
🔸 Distribution (smart money sells quietly)
Then price explodes away from that zone, showing that a major order cluster was executed.
This explosive move creates:
🔥 Imbalance (FVG)
🔥 Break of structure (BOS)
🔥 A directional trend
These are all signs of institutional activity.
📌 Types of Order Blocks 🟥🟩
🟥 Bearish Order Block (B-OB)
The last bullish candle before a strong bearish move.
It marks institutional selling.
🟩 Bullish Order Block (B-OB)
The last bearish candle before a strong bullish move.
It marks institutional buying.
Both act as high-probability reaction zones.
📌 How Institutions Use Order Blocks 🎯🏦
Institutions don’t enter all at once — their orders are too large.
So they:
1️⃣ Place part of their order
2️⃣ Push price away
3️⃣ Wait for retracement
4️⃣ Fill the rest at the same zone
That zone = the Order Block.
Price returning to an OB is not random — it’s smart money completing their business. 💼✨
📌 How You Trade Order Blocks 🧘♂️📈
✔️ Identify the strong move
Big displacement = institutional interest. 🚀
✔️ Mark the Order Block candle
The last opposite candle before the move. 🔍
✔️ Wait for price to return
Smart money loves to rebalance orders. 🔁
✔️ Enter with confirmation
Candles + structure + reaction = high probability. 🎯
Order Blocks are not predictions — they are reaction zones with a smart-money edge.
📌 Why Order Blocks Work So Well 🌟
Because they are built on:
💧 Liquidity
🧠 Smart Money Behavior
📊 Market Structure
⚡ Supply & Demand
🔥 Institutional Order Flow
This is why OBs outperform classic support/resistance.
They show institutional reality, not retail imagination.
✨ Final Thoughts: The Power of Order Blocks 🚀
Once you learn Order Blocks, everything becomes clearer:
✔️ You know where big money enters
✔️ You know where to wait for price
✔️ You stop chasing bad trades
✔️ You trade WITH smart money
✔️ You catch cleaner, stronger moves
Order Blocks are the foundation of modern price action — simple, powerful, and deeply effective. 🔥📈
Community ideas
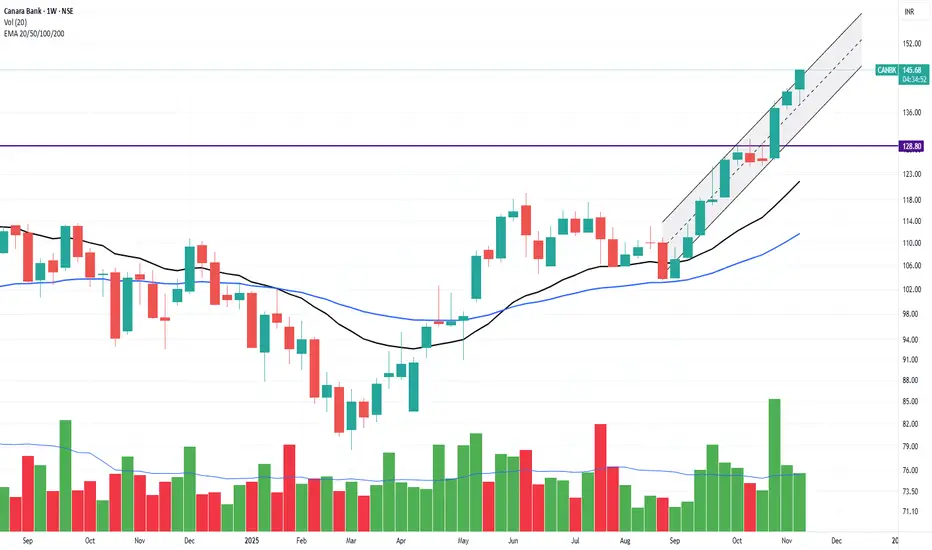
PSU BANK AVAILABLE AT FAIR VALUATION NOW: BREAKOUT IN CANARABANkAmong Indian PSU banks, Canara Bank currently stands out as available at a fair valuation, with a low price-to-earnings (P/E) ratio of around 6.6 and a price-to-book (P/B) value near 1.1, which makes it attractive compared to peers. Bank of India and Union Bank of India also screen as fairly valued, both hovering around P/E ratios of 6.3–6.9 and similar P/B multiples.
Notable PSU Banks for Fair Valuation
* Canara Bank: P/E 6.6, P/B 1.1, with strong return on equity (ROE) and return on assets (ROA), making it a value pick in current market conditions.
* Bank of India: P/E 6.9, P/B close to 1, and intrinsic value estimates within reasonable bounds for current prices.
* Union Bank of India: P/E 6.3, P/B 1.1, delivering consistent profit growth and maintaining attractive valuations.
Market Sentiment
With PSU banks reporting strong profit growth in recent quarters, the sector overall offers valuation support, but bottom-up stock selection remains vital. Canara Bank and Bank of India are currently among the most fairly valued, making them stand out for investors seeking value in the PSU banking segment.
For a long-term perspective, review each bank's NPA ratios, consistent profitability, and any recent regulatory changes that could impact valuations.
How Businesses Can Grow in the Trading Market1. Understanding the Trading Market
The trading market encompasses multiple segments—stock trading, forex (foreign exchange), commodity trading, derivatives, and cryptocurrency trading. Each market functions under different regulatory, economic, and technological frameworks but shares a common goal: facilitating the exchange of value and risk between buyers and sellers.
For businesses entering trading, the first step to growth is a deep understanding of the market structure, participant behavior, and factors influencing price movements. Knowledge of supply-demand dynamics, macroeconomic indicators, and geopolitical influences helps in making informed trading decisions. Companies that invest in market intelligence and data analysis often find themselves ahead of competitors.
2. Building a Strong Trading Infrastructure
A key driver of growth in the trading market is technological infrastructure. In today’s environment, speed, accuracy, and connectivity define success. Businesses must invest in:
Trading Platforms: Using robust platforms like MetaTrader, Bloomberg Terminal, or proprietary systems ensures efficiency in execution.
Data Analytics Tools: Real-time data processing, AI-driven insights, and predictive analytics help in identifying opportunities early.
Connectivity and APIs: Fast internet connections and integration with exchanges through APIs enhance automation and scalability.
Cybersecurity: As trading becomes digital, safeguarding systems from cyber threats is essential for operational continuity and client trust.
A business that leverages advanced technology can scale operations globally while minimizing transaction errors and latency.
3. Strategic Diversification
One of the fundamental principles for business growth in the trading market is diversification. Relying on a single asset class or market exposes a company to unnecessary risk. Successful trading businesses diversify in several ways:
Asset Diversification: Engaging in equities, forex, commodities, and derivatives reduces dependence on one market.
Geographical Diversification: Expanding into international markets allows firms to capitalize on regional opportunities and time-zone differences.
Product Diversification: Offering products like ETFs, mutual funds, or structured products can attract a broader client base.
Diversification not only stabilizes revenue but also opens multiple income streams that cushion the impact of market volatility.
4. Leveraging Technology and Automation
Technology plays a transformative role in the trading market. Automated and algorithmic trading systems have revolutionized how businesses operate. Algorithms can execute large volumes of trades within milliseconds based on pre-set strategies, removing emotional bias and increasing efficiency.
Key technological advancements supporting business growth include:
Artificial Intelligence (AI) and Machine Learning (ML): AI helps forecast price movements using pattern recognition and big data analysis.
Blockchain Technology: It enhances transparency and reduces settlement times, especially in cryptocurrency and cross-border trading.
Cloud Computing: Enables real-time access to trading data and remote operation, allowing global teams to collaborate seamlessly.
Firms that embrace automation and digital transformation gain a competitive advantage through reduced costs, higher accuracy, and faster decision-making.
5. Developing a Risk Management Framework
Trading is inherently risky due to market fluctuations, leverage, and liquidity issues. Businesses can grow sustainably only when they balance risk and reward. A strong risk management strategy involves:
Position Sizing: Limiting exposure per trade to a fixed percentage of total capital.
Stop-Loss Orders: Automatically exiting losing trades to prevent large losses.
Hedging: Using derivatives like options and futures to protect against adverse price movements.
Stress Testing: Simulating different market scenarios to assess potential impacts on the portfolio.
Risk management not only safeguards capital but also builds confidence among investors and clients.
6. Regulatory Compliance and Transparency
Growth in the trading market depends heavily on maintaining regulatory compliance. Governments and financial authorities such as SEBI (India), SEC (USA), and FCA (UK) impose rules to ensure fair trading and investor protection. Businesses that adhere to these regulations gain credibility and attract institutional clients.
Transparency in reporting, accurate record-keeping, and ethical conduct are vital for long-term growth. A reputation for integrity can distinguish a trading firm in a competitive marketplace.
7. Building a Skilled Team
A successful trading business requires a mix of analytical, technical, and strategic expertise. Recruiting skilled professionals—traders, analysts, risk managers, and developers—creates a strong foundation for growth. Additionally, ongoing training ensures the team stays updated with market trends, tools, and compliance requirements.
Companies should encourage knowledge sharing, foster innovation, and provide performance-based incentives. Human capital remains one of the most valuable assets in trading operations.
8. Adopting Data-Driven Decision Making
Data has become the new currency of the trading world. Businesses that leverage data effectively can identify trends, forecast market behavior, and optimize trading strategies. Using big data analytics allows traders to process massive volumes of historical and real-time information for better decision-making.
Predictive analytics tools can detect early signs of market shifts, while sentiment analysis (e.g., through news or social media data) provides insights into investor psychology. Data-driven approaches minimize guesswork and enhance precision.
9. Strategic Partnerships and Networking
Collaborations with financial institutions, liquidity providers, and technology vendors can accelerate growth. For instance, partnering with brokers or fintech platforms enables access to liquidity pools and advanced market tools. Networking at global financial conferences or online forums also helps in building relationships that open doors to new opportunities and insights.
Strategic alliances expand reach, enhance credibility, and reduce operational costs through shared resources.
10. Marketing and Branding in the Trading Sector
In a competitive trading environment, marketing and brand differentiation are crucial. Businesses must position themselves as reliable, transparent, and technologically advanced. Effective strategies include:
Content Marketing: Publishing insightful market analyses and trading education to attract clients.
Social Media Presence: Using platforms like LinkedIn, X (formerly Twitter), and YouTube to engage traders.
Client Support and Service Quality: Building trust through prompt assistance and transparent communication.
A strong brand helps attract both retail and institutional clients, fueling growth.
11. Expanding into New Markets
Globalization has made it easier for trading businesses to enter emerging markets where trading activity is growing rapidly. Markets in Asia, Africa, and Latin America offer rising participation and economic potential. Understanding local regulations and customizing products for regional demand helps in capturing new audiences.
Expanding internationally diversifies revenue and increases resilience against downturns in any single economy.
12. Continuous Innovation and Adaptability
The trading market evolves constantly with changing technologies, regulations, and investor preferences. To grow, businesses must remain adaptable—embracing new tools like decentralized finance (DeFi), sustainable investing, and tokenized assets.
Innovation in products, strategies, and services keeps a firm relevant and competitive. Regular review of trading models ensures alignment with current market realities.
Conclusion
Growth in the trading market is not achieved overnight—it results from a blend of strategic planning, technological investment, skilled management, and disciplined execution. Businesses that focus on diversification, automation, risk management, and compliance can build a robust foundation for sustainable expansion.
In a world where financial markets are interconnected and data-driven, success depends on how well a business can adapt to change, leverage technology, and maintain trust. By combining innovation with prudence, any trading enterprise can evolve from a small participant to a global leader in the dynamic world of trading.

Indian Derivative Secrets1. The First Secret: India is a Market Dominated by Options, Not Futures
One of the biggest secrets that new traders miss is that India’s derivatives segment is overwhelmingly options-driven. More than 95% of the total derivatives turnover comes from options.
This creates unique behavior:
Market often moves to kill option premiums → popularly called premium eating market.
Expiry days show violent moves, as both buyers and sellers fight for option decay or reward.
Weekly expiries for Nifty, Bank Nifty, and FinNifty create short-term trend cycles.
The real secret:
Options sellers (institutions, prop desks) control the market more than options buyers (retail).
Because sellers have deep pockets and margin power, they dictate pricing through:
Heavy shorting on OTM strikes
Creating artificial range-bound movements
Sudden IV crushes after major events
Pinning the market to certain levels on expiry
2. The Second Secret: Open Interest (OI) is a Map of Smart Money
Retail traders look at price; professional traders look at Open Interest.
Key principles:
1. Rising OI + Rising Price → Long Build-up
Indicates accumulation; institutions betting on upward trend.
2. Falling OI + Rising Price → Short Covering
Often triggers sharp intraday rallies.
3. Rising OI + Falling Price → Short Build-up
A strong bearish signal.
4. Falling OI + Falling Price → Long Unwinding
Leads to slow downward drift.
But the deeper secret is this:
Option OI is used to trap retail traders.
Example:
If 20 lakh OI sits at Nifty 22500 CE, it creates a wall of resistance.
If suddenly the OI reduces, it means sellers are scared → breakout incoming.
If OI spikes massively, sellers are confident → reversal incoming.
Professionals track:
Change in OI in last 5 minutes
OI shifting to higher or lower strikes
OI unwinding during big candles
These help predict short-term market moves before they show on charts.
3. The Third Secret: India’s Market is Driven by Event Volatility
Unlike global markets, Indian derivatives see unique event-driven volatility cycles:
1. RBI Policy Days
Bank Nifty’s biggest moves occur here.
IV spikes → option prices increase.
2. Budget Day
High volatility, large swings, unpredictable behavior.
3. Election Results
Massive IV spikes that crush instantly post-event.
4. US Fed Days
Indian markets react sharply the next morning.
The secret?
Option sellers thrive before the event; option buyers thrive after.
The trick is to identify IV patterns:
Before events → IV increases → selling straddles/strangles becomes risky.
After events → IV crashes → buyers lose premium but directional traders profit.
4. The Fourth Secret: FIIs Don’t Control the Market Daily — The Myth
Many retail traders assume FIIs (Foreign Institutional Investors) drive daily trends. This is not true anymore.
The secret:
Proprietary trading firms (prop desks) influence intraday to medium-term moves more than FIIs.
FIIs provide long-term liquidity, but prop firms dominate:
Day trading
Spread strategies
Gamma scalping
Weekly expiry management
Arbitrage between indices
The “intraday direction” is mostly shaped by:
Prop firms (Indian)
High-frequency trading algorithms (HFT)
Market-making firms
5. The Fifth Secret: Option Pain Theory (Max Pain) Actually Works in India
“Max Pain” is the level where the maximum number of option buyers lose money.
In India’s weekly expiry system, this theory becomes extremely powerful.
Institutions try to move the price toward max pain.
Example:
If Nifty’s max pain is at 22400
And current price is 22580
Expect slow grinding downward movement on expiry.
Why?
Because sellers want to make maximum profit from premium decay.
Max pain is not 100% accurate, but works exceptionally well:
In range-bound markets
On expiry days
When OI build-up is clean
6. The Sixth Secret: Market Makers Control Intraday Volatility
A little-known fact:
India’s intraday volatility is heavily influenced by market makers who adjust hedges every second.
They use:
Delta hedging
Gamma scalping
Vega exposure reduction
Arbitrage between futures and options
Calendar spreads
This creates sudden:
Wicks
Fake breakouts
Violent reversals
Stop-loss hunting
Retail often blames “operators”, but the real cause is market-making algorithms.
7. The Seventh Secret: Expiry Day Moves Follow a Predictable Pattern
Every Thursday (and Tuesday/Friday for other indices), the market behaves differently.
9:15–11:30 AM
Range bound → sellers dominate.
11:30–1:30 PM
Small directional move, often fake.
1:30–3:00 PM
True move begins after OI shift.
3:00–3:20 PM
Massive expiry manipulation.
Expiry tricks:
Add huge OI at far OTM strikes → trap buyers
Shift support/resistance rapidly
Trigger SLs of retailers who go long or short
The secret strategy that institutions use:
Selling ATM straddles and hedging using futures or deep OTM options.
8. The Eighth Secret: Price Moves After Retail Stops Getting Trapped
Retail trader behavior is extremely predictable:
They buy options after big candles
They short after breakdowns
They panic during retracements
They buy tops and sell bottoms
Institutions use this to create traps:
Bull Trap
Breakout → triggers retail longs → market reverses.
Bear Trap
Breakdown → triggers retail shorts → market reverses.
The secret is to analyze:
Long/short buildup data
OI spikes near key levels
Market structure on 5-minute charts
9. The Ninth Secret: Volume Profile + OI = Institutional Footprint
The biggest secret weapon in derivatives trading is combining volume with OI.
1. High Volume + High OI → Strong Institutional Position
Expect a trend continuation.
2. High Volume + OI Unwinding → Trend Reversal
Institutions are exiting.
3. Low Volume + High OI → Trap Zone
Retail buyers are trapped; avoid entries.
Conclusion
Indian derivatives trading is not random — it follows the logic, psychology, and positioning of big players, OI structure, volatility cycles, and institutional strategies. The key secrets revolve around understanding who controls the market, how OI shapes price, how algorithms influence intraday volatility, and how weekly expiries create predictable traps and opportunities.
If you master these hidden mechanisms, derivatives trading transforms from gambling into a strategic and probability-driven game.

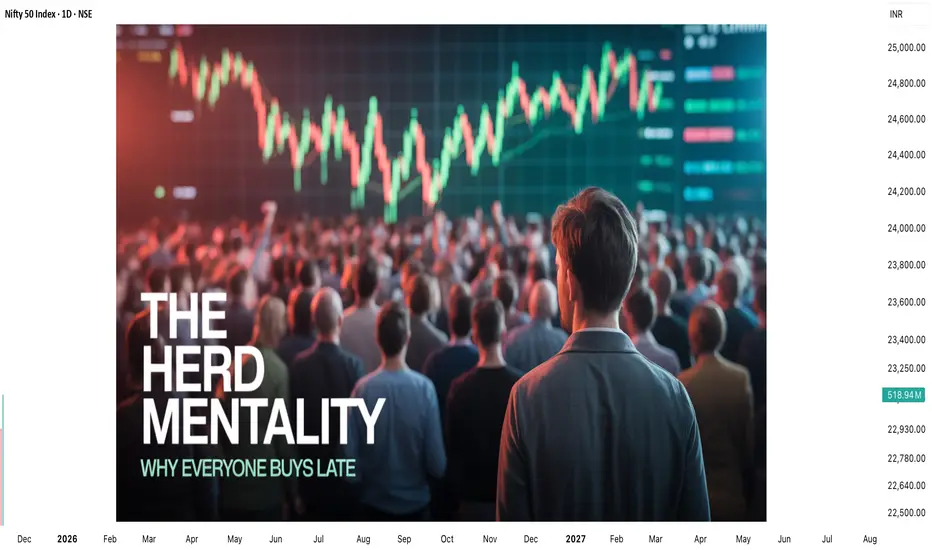
The Herd Mentality – Why Everyone Buys When It’s Too Late?Hello Traders!
You’ve seen it a hundred times, the market rallies, social media explodes, and suddenly everyone starts buying.
Then, just when retail traders feel “safe” entering, the price crashes.
It’s not bad luck, it’s herd mentality .
And unless you understand how it works, you’ll keep following the crowd straight into losses.
1. What is Herd Mentality in Trading?
Herd mentality is the instinct to do what everyone else is doing, buying when others buy, selling when others sell.
It’s rooted in human psychology, our brains feel safer when we’re part of a group.
In trading, this instinct is deadly because the crowd always reacts late.
When you feel comfortable entering a trade, it’s usually because the market has already moved.
2. The Cycle of Fear and Greed
Every bull run begins with a few smart traders who buy quietly when no one’s interested.
As prices rise, social media hype builds, the crowd starts joining in.
Then, when “everyone” is talking about the coin, smart money exits, leaving the herd trapped at the top.
The same happens in bear markets, panic selling at bottoms while professionals buy patiently.
It’s not about intelligence, it’s about emotion.
3. How the Market Exploits the Crowd
Institutions and big traders understand herd behavior better than anyone.
They create liquidity by pushing prices to levels where retail traders feel emotionally forced to act.
The market uses human nature, fear and greed, as its fuel.
The crowd provides the liquidity, and professionals use that liquidity to enter or exit quietly.
4. How to Avoid Becoming Part of the Herd
Develop your own plan, if your entry depends on others’ excitement, it’s not your setup.
Buy when the market feels uncomfortable; sell when everyone feels confident.
Learn to think independently. The best trades usually feel the hardest to take.
Patience and conviction are your weapons against the herd.
5. The Truth Most Traders Don’t Want to Hear
If you wait for social proof to feel confident, you’ll always be late.
By the time the crowd “believes,” the move is already priced in.
You don’t get rich by following others, you get rich by understanding why others behave the way they do.
Rahul’s Tip:
The market doesn’t punish retail traders because they lack knowledge, it punishes them because they act emotionally together.
Train your mind to do what’s uncomfortable, not what’s popular. That’s where the profit hides.
Conclusion:
The herd mentality is the silent killer of most portfolios.
The more people talk about an asset, the less opportunity it holds.
Smart traders buy silence and sell noise.
Once you learn to think independently, you’ll stop being the liquidity, and start trading like the ones who create it.
If this post opened your eyes to herd psychology, like it, share your view in comments, and follow for more deep market insights!
Part 2 Intraday Trading Master ClassWhy Option Trading Is Growing Rapidly in India
In recent years, India has seen an explosive rise in options trading due to:
Weekly expiries (more opportunity)
Low entry capital
High liquidity in BankNifty and Nifty options
Rise of online brokerages
Wide availability of market data and tools
Social media awareness
Because of the leverage and excitement options offer, many new traders are drawn to them—though disciplined ones survive longer.

Who Controls the Trade Market?1. Governments and National Policies
Governments are among the most significant influencers of global trade. They do not directly “control” the entire trade market but shape it through:
a. Trade Policies
Countries impose:
Tariffs
Import/export taxes
Quotas
Subsidies
Sanctions
These tools can encourage or restrict trade. For example, a country may impose tariffs on imported steel to protect its local steel industry, affecting global steel prices and trade flows.
b. Trade Agreements
Nations sign bilateral and multilateral agreements such as:
WTO Agreements
Regional trade blocs (EU, ASEAN, NAFTA/USMCA, MERCOSUR)
Free trade agreements (India–UAE CEPA, EU–Japan EPA)
Such agreements define tariff structures, market access, rules of origin, and dispute mechanisms. They create predictable trade environments that shape global flows.
c. Currency and Monetary Policy
Governments influence their currency through central banks, affecting:
Export competitiveness
Import costs
Balance of payments
For example, a weaker currency makes a country’s exports cheaper globally, increasing trade activity.
2. Central Banks and Interest Rate Policies
Central banks indirectly influence the trade market by controlling:
Interest rates
Foreign exchange reserves
Money supply
Inflation
These factors alter import/export demand, capital flows, and trade financing costs. The U.S. Federal Reserve, ECB, Bank of Japan, and People's Bank of China have an outsized influence because their currencies drive global trade settlements.
3. The World Trade Organization (WTO)
The WTO does not “control” trade but regulates and oversees the global trading system. It:
Sets rules for fair trade
Resolves trade disputes
Ensures nondiscriminatory trade practices
Manages global tariff schedules
When trade conflicts arise—such as U.S.–China tariff disputes—WTO rulings influence the direction of global commerce.
4. Global Corporations and Multinational Companies
Large corporations have enormous power over global trade because they operate massive supply chains that span continents. This includes:
Tech giants like Apple, Samsung, and TSMC
Automotive leaders like Toyota, Volkswagen, and Tesla
Energy majors like ExxonMobil, Saudi Aramco, BP
Retail giants like Amazon, Walmart
These companies determine:
Where factories are located
What resources are needed
How goods move across borders
Because of their sheer scale, multinational companies influence labor markets, commodity demand, transportation networks, and global logistics.
5. Commodity Exchanges and Financial Markets
International exchanges play a key role in price discovery. Examples include:
Chicago Mercantile Exchange (CME) – agriculture, energy, metals
London Metal Exchange (LME) – base metals
New York Stock Exchange (NYSE) – equities
ICE – energy, sugar, cotton
These exchanges:
Set global benchmark prices
Facilitate futures and options trading
Provide hedging tools for buyers and sellers
Thus, financial traders and institutions heavily influence short-term market movements, especially in oil, gold, crops, and currencies.
6. Banks and Financial Institutions
Trade requires financing. Large banks such as:
JPMorgan
HSBC
Citi
Deutsche Bank
Standard Chartered
provide:
Letters of credit
Trade loans
Forex settlement
Risk management tools
Without these institutions, global trade would slow dramatically, especially for developing economies.
7. Geopolitical Powers and Global Politics
Political decisions deeply affect trade. The world’s major power centers—the U.S., China, EU, India, Japan, Russia—shape trade through:
Economic alliances
Trade warfare (tariffs, sanctions)
Military presence near trade routes
Resource control
Investment in foreign infrastructure
Geopolitical tensions such as the Russia–Ukraine war, South China Sea disputes, or Middle Eastern conflicts often disrupt supply chains, shipping lanes, and commodity prices.
8. Cartels and Organized Commodity Groups
Some commodities are influenced by producer groups or cartels. The most powerful example is:
OPEC
The Organization of the Petroleum Exporting Countries coordinates oil production to influence global oil prices.
Although they do not fully control the oil market, their decisions strongly impact:
Crude supply
Energy prices
Inflation globally
Other organized groups exist in diamonds, copper, and certain agricultural sectors, but none are as influential as OPEC.
9. Supply Chain and Logistics Networks
Trade physically moves through:
Shipping companies
Port authorities
Airlines
Freight forwarders
Rail networks
Global shipping giants like Maersk, MSC, and COSCO operate vast fleets and control a significant portion of global container movement. Congestion at a major port can affect trade worldwide.
10. Digital Platforms, E-Commerce, and Technology
In the 21st century, platforms such as Alibaba, Amazon, and Shopify influence global trade patterns by enabling cross-border commerce at scale.
Additionally, digital tools like:
AI forecasting
Blockchain-based trade finance
Real-time logistics tracking
Mobile payments
have increased trade efficiency and reduced barriers.
11. Consumers and Market Demand
Ultimately, consumer behavior controls the direction of trade. Their preferences shape:
What goods are produced
Where they are sourced
How companies market products
For example:
Rising demand for electric vehicles increases global trade in lithium, cobalt, and battery components.
Demand for fast fashion drives textile imports and exports.
Consumers collectively act as a “silent controller” of trade.
12. Conclusion — A System, Not a Single Controller
The trade market is not controlled by any one entity. Instead, it operates as a dynamic ecosystem shaped by:
Governments
Corporations
Financial markets
Regulators
Central banks
Geopolitical forces
Supply chain networks
Consumers
Part 7 Trading Master Class With Experts Types of Option Strategies
Option trading is not just about buying calls or puts; it involves strategic combinations to profit under various market conditions. Some popular strategies include:
a) Bullish Strategies
Bull Call Spread: Buying a lower strike call and selling a higher strike call.
Bull Put Spread: Selling a higher strike put and buying a lower strike put.
b) Bearish Strategies
Bear Call Spread: Selling a lower strike call and buying a higher strike call.
Bear Put Spread: Buying a higher strike put and selling a lower strike put.
c) Neutral Strategies
Iron Condor: Selling one call and one put at close strikes while buying further out-of-the-money options.
Straddle: Buying both a call and put at the same strike to profit from big moves in either direction.
Strangle: Buying a call and a put at different strikes to benefit from volatility.
These strategies allow traders to earn consistent returns by managing risk rather than relying purely on market direction.

Part 8 Trading Master Class With ExpertsRisks in Option Trading
While options offer great potential, they also come with risks, especially for sellers.
Time Decay: The value of an option decreases as it nears expiry.
Volatility Risk: Unexpected drops in volatility can reduce premium value.
Unlimited Loss (for Writers): Option sellers can face huge losses if the market moves sharply against them.
Complexity: Understanding option behavior and Greeks requires knowledge and experience.
Therefore, beginners should start small and practice on demo accounts or low-risk strategies before committing large capital.

Premium Chart AnalysisHow to Trade Chart Patterns
To effectively trade chart patterns, follow these steps:
Identify the Pattern Early
Use clear trendlines to mark support and resistance zones.
Confirm shape and symmetry before assuming a pattern.
Wait for Breakout Confirmation
A breakout should be supported by volume expansion—this validates the move.
Avoid acting before confirmation; false breakouts are common.
Set Entry and Exit Points
Enter after a confirmed breakout (preferably with candle close beyond resistance/support).
Target = Height of pattern projected from breakout point.
Stop-loss = Just below (for bullish) or above (for bearish) the breakout level.
Use Multiple Timeframe Analysis
Confirm pattern on higher timeframes to avoid false signals.
Align short-term setups with long-term trends for stronger conviction.

Part 6 Learn Institutional Trading
Option Greeks
Option traders use “Greeks” to measure how different factors affect the price of an option:
Delta: Measures how much the option price changes with a ₹1 change in the underlying.
Gamma: Measures the rate of change of Delta.
Theta: Measures time decay – how much value an option loses each day as expiry approaches.
Vega: Measures sensitivity to volatility.
Rho: Measures sensitivity to interest rates.
Understanding Greeks helps traders manage risk and make informed decisions.

Part 3 Learn Institutional Trading How Option Trading Works
When you trade options, you’re speculating on how the price of the underlying asset will move within a specific time frame. Here’s how it works for both types of options:
a) Call Option Example
Suppose Reliance stock is trading at ₹2,500. You buy a Call Option with a strike price of ₹2,520, paying a premium of ₹20.
b) Put Option Example
You buy a Put Option on Reliance with a strike price of ₹2,480 and pay a ₹15 premium.

Part 2 Ride The Big Moves Key Terminology in Option Trading
To understand option trading, you must be familiar with a few important terms:
Underlying Asset: The financial instrument (e.g., NIFTY, Bank NIFTY, Reliance Industries) on which the option is based.
Strike Price: The fixed price at which the underlying can be bought or sold.
Premium: The price paid by the buyer to the seller for owning the option contract.
Expiry Date: The last day on which the option can be exercised. In India, index options usually expire weekly or monthly.
Lot Size: The minimum quantity of the underlying asset that can be traded per option contract.
In the Money (ITM): When exercising the option gives a profit.
At the Money (ATM): When the strike price equals the current market price.
Out of the Money (OTM): When exercising the option gives no profit.

Part 1 Ride The Big Moves What is an Option?
An option is a financial derivative whose value is derived from an underlying asset such as a stock, index, or commodity. Options come in two primary forms:
Call Option: It gives the holder the right to buy the underlying asset at a predetermined price (known as the strike price) before or on the expiry date.
Put Option: It gives the holder the right to sell the underlying asset at a predetermined strike price before or on the expiry date.
The buyer of an option pays a premium to the seller (also called the writer) for this right. The seller receives the premium as income but takes on the obligation to buy or sell the asset if the buyer chooses to exercise the option.

Crypto Assets Secrets: The Hidden Dynamics of Digital Wealth1. The Foundational Secret: Blockchain is the Core
The first and most fundamental secret of crypto assets lies in the technology that powers them — the blockchain. Unlike traditional financial systems controlled by banks or governments, blockchain is a decentralized digital ledger that records transactions securely, transparently, and permanently. Each transaction is verified through a consensus mechanism, ensuring trust without intermediaries.
What makes this technology revolutionary is its immutability and transparency. Every coin or token can be traced to its origin, which eliminates fraud and enables a new form of digital ownership. Investors who understand blockchain’s technical structure — from proof-of-work (PoW) to proof-of-stake (PoS) — gain insights into which crypto projects are sustainable versus those that are purely speculative.
2. The Scarcity Secret: Supply Mechanisms Define Value
Another major secret behind crypto value lies in tokenomics — the economic design of a cryptocurrency. Bitcoin, for example, has a fixed supply of 21 million coins, making it deflationary. This limited availability fuels demand, positioning Bitcoin as a “digital gold.”
In contrast, many altcoins use different supply models — such as inflationary tokens or tokens with burning mechanisms. Understanding supply dynamics, such as halving events, staking rewards, and token burns, can provide an edge. Long-term investors often look for assets with a balanced token supply and strong utility, as these tend to appreciate in value over time.
3. The Adoption Secret: Utility Drives Sustainability
While many cryptocurrencies emerge daily, few achieve lasting success. The secret to survival in the crypto market is real-world utility. Coins that solve genuine problems — such as Ethereum’s smart contracts, Chainlink’s decentralized oracles, or Ripple’s cross-border payment systems — tend to achieve mainstream adoption.
Utility also extends into DeFi platforms, NFT marketplaces, and metaverse ecosystems. Projects that integrate their tokens into actual services or decentralized applications (dApps) create intrinsic demand. The secret is to identify projects where use cases and network effects fuel organic growth rather than mere hype.
4. The Liquidity Secret: Market Depth and Whale Control
Liquidity — the ease of buying or selling an asset without drastically affecting its price — is a critical yet often overlooked secret of crypto trading. Cryptocurrencies with high liquidity (like Bitcoin and Ethereum) are more stable and less prone to manipulation. In contrast, low-liquidity altcoins can experience extreme volatility due to the influence of whales — large holders who can manipulate prices with a few transactions.
Smart traders monitor order books, volume profiles, and whale wallet movements to predict short-term market fluctuations. Tools like on-chain analytics (Glassnode, Santiment, Nansen) reveal where big money is flowing, offering insight into potential price trends before they hit mainstream awareness.
5. The Psychological Secret: Fear and Greed Index
Crypto markets are driven more by emotion than fundamentals. The Fear and Greed Index, which tracks market sentiment, often predicts price movements better than technical indicators. Extreme fear signals potential buying opportunities, while extreme greed suggests a bubble.
Successful traders understand that patience and discipline are their greatest assets. They use emotional intelligence to avoid panic-selling during downturns or over-leveraging during bull runs. The secret lies in contrarian thinking — buying when others are fearful and selling when others are euphoric.
6. The Timing Secret: Market Cycles and Halving Events
Crypto markets move in predictable cycles, often tied to Bitcoin halving events (which occur approximately every four years). These events reduce the number of new Bitcoins entering circulation, historically triggering bull markets as scarcity increases.
Understanding the crypto cycle — accumulation, expansion, euphoria, and correction — gives traders an edge. The secret is to accumulate during bear markets when prices are undervalued and to take profits strategically during euphoric phases. Experienced investors don’t chase trends; they anticipate them through cycle analysis and macroeconomic awareness.
7. The DeFi Secret: Earning Passive Income
Decentralized Finance (DeFi) has unlocked a secret layer of wealth generation in crypto: passive income. Through staking, yield farming, and liquidity mining, investors can earn rewards without actively trading. For example, staking Ethereum 2.0 provides returns of 4–6% annually, while liquidity providers in decentralized exchanges like Uniswap or PancakeSwap earn transaction fees.
However, the secret to success in DeFi lies in risk management — avoiding projects with unaudited smart contracts or unsustainable yields. Genuine DeFi opportunities combine transparency, security, and innovation to create long-term income potential.
8. The Security Secret: Custody and Privacy
Many investors underestimate the importance of security. The crypto space is rife with hacks, phishing attacks, and rug pulls. The secret here is self-custody — storing crypto in hardware wallets (like Ledger or Trezor) instead of centralized exchanges.
Private key management is crucial. “Not your keys, not your coins” is a golden rule — meaning that if an exchange holds your keys, they control your assets. Using multi-signature wallets, two-factor authentication (2FA), and cold storage ensures protection against digital theft. Privacy coins like Monero and Zcash also provide enhanced confidentiality for transactions, appealing to users who value financial anonymity.
9. The Innovation Secret: Layer 2, Web3, and AI Integration
The next wave of crypto innovation revolves around scalability and interoperability. Layer 2 solutions such as Polygon, Arbitrum, and Optimism are solving Ethereum’s high gas fee and congestion issues. These projects are crucial to the long-term scalability of the blockchain ecosystem.
Simultaneously, the emergence of Web3 — the decentralized internet — is redefining data ownership and monetization. AI integration into blockchain is another secret growth area, where artificial intelligence can enhance smart contracts, fraud detection, and algorithmic trading. Investors who identify early-stage projects in these emerging sectors gain significant advantages.
10. The Regulatory Secret: Compliance Determines Longevity
While decentralization is a key appeal, regulation is the ultimate test for a cryptocurrency’s survival. Governments worldwide are developing frameworks for crypto taxation, anti-money laundering (AML), and investor protection. The secret here is that regulated compliance breeds legitimacy.
Projects that adapt to evolving laws — such as stablecoins backed by audited reserves or exchanges with proper licensing — tend to attract institutional investment. Understanding the regulatory landscape helps investors separate credible projects from high-risk ventures that might face legal challenges.
11. The Institutional Secret: Big Money Shapes the Market
Since 2020, major financial institutions have entered the crypto space, adding liquidity and credibility. Firms like BlackRock, Fidelity, and Grayscale have introduced Bitcoin ETFs and custody services. The secret is to watch institutional behavior — accumulation patterns, ETF flows, and custody adoption — as these signal market direction.
Institutional involvement also bridges the gap between traditional finance (TradFi) and decentralized finance (DeFi), paving the way for mass adoption. Investors who align with institutional trends rather than retail speculation often achieve more consistent returns.
12. The Education Secret: Knowledge Outperforms Hype
Ultimately, the greatest secret in crypto is education. Markets reward those who understand blockchain fundamentals, on-chain analytics, risk assessment, and macroeconomics. Many retail investors lose money due to lack of research and herd mentality.
Continuous learning — through whitepapers, developer updates, and reputable crypto analysts — is the real key to long-term success. The crypto world evolves rapidly, and only informed participants can adapt to its volatility and innovation.
Conclusion
Crypto assets are more than speculative digital tokens; they represent a paradigm shift in how the world perceives money, value, and trust. The “secrets” of crypto lie not in hidden tricks but in understanding its core principles — decentralization, scarcity, utility, and innovation. By mastering the fundamentals of blockchain technology, emotional discipline, market cycles, and security, investors can navigate this digital revolution wisely.
In essence, success in crypto isn’t about timing the market; it’s about understanding the market — its psychology, technology, and evolving potential. Those who embrace this knowledge stand to uncover not just financial rewards, but also a front-row seat to the future of global finance.
Volume Profile and Market Analysis1. Understanding Volume Profile
The Volume Profile is a histogram plotted on the price axis of a chart, showing the amount of traded volume at each price level during a specified period. Rather than displaying how much volume was traded per time unit (like a standard volume bar at the bottom of a chart), it shows where the majority of trading occurred within a price range.
This data allows traders to see which prices attracted the most attention from buyers and sellers, and which levels were quickly rejected. In essence, Volume Profile reveals the “market’s memory”—where the majority of market participants placed their bets.
2. Key Components of Volume Profile
To fully understand how to interpret Volume Profile, traders must become familiar with its key elements:
Point of Control (POC):
The price level with the highest traded volume during the selected period. It represents the fairest price—where buyers and sellers reached the greatest consensus.
Value Area (VA):
Typically, this covers about 70% of total traded volume and represents the range of prices considered “fair value” for the market. Prices outside this range are often seen as overbought or oversold.
Value Area High (VAH) and Value Area Low (VAL):
These boundaries mark the upper and lower limits of the Value Area. They act as important support and resistance levels.
High Volume Nodes (HVN):
Price zones where a large amount of trading occurred, indicating acceptance and stability. These levels often act as magnets for price.
Low Volume Nodes (LVN):
Price zones with very little trading activity, indicating rejection or imbalance. These often serve as breakout or reversal points.
3. Interpreting Volume Profile in Market Context
The market moves through cycles of accumulation, distribution, expansion, and contraction, and the Volume Profile helps visualize these phases:
Balanced Profile (D-shaped):
Indicates a period of consolidation where supply and demand are balanced. Price oscillates within a range around the POC, suggesting indecision. Breakouts from such zones often lead to strong directional moves.
Trending Profile (P-shaped or b-shaped):
A P-shaped profile shows a short-covering rally, where price moved upward and volume concentrated near the top of the profile. Conversely, a b-shaped profile indicates long liquidation—strong selling followed by stabilization at lower prices.
Double Distribution Profile:
This occurs when the market transitions between two value areas, indicating a shift in sentiment or a major fundamental change.
By reading these structures, traders can identify whether the market is in a state of balance (range-bound) or imbalance (trending), and adjust their strategies accordingly.
4. Volume Profile vs. Market Profile
Although they sound similar, Volume Profile and Market Profile are distinct:
Market Profile (developed by Peter Steidlmayer) organizes price and time data to show where the market spent the most time.
Volume Profile focuses purely on volume traded at each price level.
While Market Profile emphasizes time-based value areas, Volume Profile provides a clearer view of actual market participation, making it more precise for detecting liquidity zones and institutional activity.
5. Volume Profile in Different Market Types
a) In Forex Markets
Volume in spot forex is decentralized and not directly measurable like in stocks or futures. Traders often rely on tick volume as a proxy, using Volume Profile tools provided by brokers that aggregate order flow data. Volume analysis helps identify key price levels where large participants—such as banks or hedge funds—are active.
b) In Stock Markets
Volume Profile is particularly effective since exchanges record every share traded. Traders use it to find areas of institutional accumulation or distribution, often near earnings announcements, mergers, or economic reports.
c) In Futures and Commodities
Volume Profile is integral to futures trading because these markets are centralized. Traders often overlay Volume Profile with open interest and Cumulative Delta (buy vs. sell volume) to interpret real market intent.
6. Combining Volume Profile with Market Analysis
Volume Profile on its own is powerful, but when integrated into broader market analysis, it produces deeper insights.
a) Technical Analysis Integration
Support and Resistance:
VAH and VAL naturally act as strong support and resistance zones.
Breakouts:
Price breaking above VAH or below VAL with high volume often signals a continuation of the trend.
Trend Confirmation:
Aligning the slope of the profile with moving averages or trendlines helps confirm momentum.
b) Fundamental Analysis Connection
Fundamental events such as interest rate decisions, earnings reports, or geopolitical news can trigger high-volume shifts. By analyzing how the Volume Profile responds, traders can identify whether institutions are building or exiting positions in reaction to the news.
c) Sentiment and Order Flow
Volume Profile aligns naturally with order flow analysis—tracking buying and selling pressure at key price levels. Combining it with sentiment indicators (like COT reports or social sentiment data) helps validate whether retail traders or institutions dominate a move.
7. Institutional Trading and Volume Profile
Institutional players often execute trades at specific volume levels to mask their intentions. The Volume Profile reveals these footprints:
Accumulation Zones:
Large volumes at stable prices after a decline often indicate institutional buying.
Distribution Zones:
Heavy volume after an uptrend suggests institutions are offloading positions.
Liquidity Traps:
Price spikes into low-volume zones followed by rejections often represent false breakouts designed to trap retail traders.
By reading these patterns, retail traders can align with institutional behavior instead of being trapped by it.
8. Advantages of Volume Profile Analysis
Precision: Identifies key price levels where volume is concentrated.
Market Context: Reveals balance vs. imbalance zones.
Institutional Insight: Shows where large traders are active.
Support/Resistance Accuracy: More reliable than indicators based on time.
Adaptability: Works across all asset classes and timeframes.
9. Limitations of Volume Profile
Lagging Nature: It shows historical participation, not future intent.
Data Dependency: Requires accurate tick or trade data; less reliable in decentralized markets like spot forex.
Complex Interpretation: Needs context—volume alone can mislead without price action or trend confirmation.
Short-Term Noise: Small timeframes may show excessive detail that obscures meaningful levels.
10. Practical Application in Trading
A practical Volume Profile-based strategy might look like this:
Identify Balance Area: Observe where the majority of volume has occurred over recent sessions.
Mark VAH, VAL, and POC: These become your reference levels.
Wait for Imbalance: Watch for price breaking out of the value area with high volume.
Confirm with Price Action: Look for retests of VAH/VAL or the POC for potential entries.
Manage Risk: Use low-volume nodes or opposite side of the value area as stop-loss levels.
This method aligns trading decisions with institutional activity and real market structure rather than arbitrary indicators.
11. The Future of Volume and Market Analysis
As financial markets become increasingly algorithm-driven, volume-based analytics are evolving through machine learning, order book heatmaps, and real-time flow data visualization. These tools allow traders to not only see where the market has traded, but where orders are currently resting—providing predictive insight into potential price reactions.
Volume Profile remains the backbone of this new generation of trading tools, bridging the gap between traditional chart reading and data-driven market intelligence.
Conclusion
Volume Profile is more than a charting tool—it’s a framework for understanding the psychology of the market. By showing how volume is distributed across price levels, it uncovers the footprints of professional traders and institutions. When combined with technical, fundamental, and sentiment analysis, it allows traders to operate with greater precision, confidence, and understanding of market structure.
In a world of fast-moving markets and complex algorithms, mastering Volume Profile and integrating it into comprehensive market analysis is an essential skill for any serious trader seeking an edge in today’s global financial landscape.
Sector Rotation StrategiesWhat Is Sector Rotation?
Sector rotation refers to the practice of shifting investments from one sector of the economy to another based on changing market conditions, economic cycles, and investor sentiment. Markets do not move uniformly—some areas outperform during economic expansion, others during contraction. For example:
When the economy is booming, cyclical sectors like automobiles, metals, real estate, and banks outperform.
When the economy slows, investors prefer defensive sectors like FMCG, healthcare, utilities, and IT services.
The core idea is: follow where the money is flowing, not where prices have already rallied.
Why Sector Rotation Works
Sector rotation is rooted in behavioral finance and macroeconomics. Institutional investors—mutual funds, FIIs, pension funds—allocate capital to sectors depending on their outlook for earnings growth, interest rates, inflation, and liquidity. As they rotate capital:
Strong sectors get stronger due to inflows.
Weak sectors remain weak or lag behind.
Retail traders often enter at the end of a rally, but sector rotation strategies allow you to anticipate moves earlier because sector performance leads stock performance.
The Business Cycle & Sector Rotation
To understand sector rotation, you must understand the economic cycle, which typically moves through five stages:
1. Early Recovery Phase
Interest rates remain low.
Liquidity is high.
Consumer and business spending picks up.
Outperforming sectors:
Automobiles
Banks & Financials
Real Estate
Capital Goods
Reason: These sectors are sensitive to credit, growth, and consumer spending.
2. Mid-Cycle Expansion
Economy grows at a stable pace.
Corporate earnings rise.
Market sentiment is positive.
Winning sectors:
Metals & Mining
Industrials
Technology
Infrastructure
Mid-cap and small-cap stocks
Reason: Companies expand operations and capex increases.
3. Late Cycle
Inflation increases.
Interest rates begin rising.
Market becomes volatile.
Strong performers:
Energy (Oil & Gas)
Commodities
Power
PSU sectors
Reason: Prices of energy and commodities improve due to inflation and supply constraints.
4. Recession / Slowdown
GDP weakens.
Spending slows.
Markets correct sharply.
Defensive sectors shine:
FMCG
Healthcare / Pharma
Utilities (Power, Gas Distribution)
Consumer Staples
Reason: Demand for essentials remains stable even in downturns.
5. Early Recovery Again
Cycle starts again as central banks cut rates and liquidity returns.
Indian Market Examples
Sector rotation plays out very visibly in India:
When RBI cuts rates → Banks, Realty, Autos rally first.
When inflation rises → FMCG, Pharma outperform.
When global commodity prices spike → Metals, Oil & Gas surge.
During IT outsourcing demand booms → Nifty IT becomes a leader.
When the government pushes capex → Infrastructure & PSU stocks take off.
For example:
In 2020-21, IT and Pharma led the rally after COVID.
In 2022, Metals and PSU banks outperformed due to global inflation.
In 2023-24, Railways and Defence were the strongest due to government spending.
In 2024-25, Financials and Energy gained leadership.
Sector rotation keeps happening because no sector leads forever.
Tools Used for Sector Rotation Analysis
1. Relative Strength (RS)
Compare performance of one sector vs Nifty 50.
If RS > 0 → sector outperforming
If RS < 0 → sector lagging
Traders often use:
Ratio charts (NIFTYSECTOR / NIFTY50)
RRG charts (Relative Rotation Graphs)
2. Price Action & Breakouts
Sectors forming:
Higher highs–higher lows
Breakouts on weekly charts
Often start outperforming for months.
3. Volume Profile
You track:
Institutional accumulation zones
High volume nodes
Breakout volumes
Sector rotation shows up as big volume shifts from one sector to another.
4. Market Breadth
Number of advancing stocks vs declining stocks in a sector helps identify internal strength before price rally starts.
Top Practical Sector Rotation Strategies
Strategy 1: Follow Market Cycles
Identify if India is in:
Expansion
Peak
Slowdown
Recovery
Then pick sectors accordingly.
This is the classic macro-driven approach.
Strategy 2: Follow Institutional Flows
Monitor:
FII sectoral holdings
Mutual fund monthly fact sheets
Volume increase in sectoral indices
If institutions are buying a sector for 3–4 months continuously, a long-term trend is beginning.
Strategy 3: Ratio Chart Method
Daily or weekly ratio charts give very clear guidance.
Example:
NIFTYBANK / NIFTY50 rising → banks leading
CNXIT / NIFTY50 rising → IT leadership pattern
If the ratio chart breaks out → shift capital to that sector.
Strategy 4: Top-Down Approach
A professional hedge-fund style method:
Analyze global macro trends
Identify strong Indian sectors
Select top stocks inside those sectors
Enter on pullbacks or breakouts
This avoids random stock picking and aligns you with the strongest flows.
Strategy 5: Rotation Within the Cycle
Within major rotations, micro rotations happen too.
Example:
Inside defensive rotation:
First FMCG moves
Then Pharma
Then Utilities
Inside growth rotation:
First Banks
Then Autos
Then Realty
Each mini-rotation gives trading opportunities.
Strategy 6: Quarterly Earnings Based Rotation
Before and after results, money flows into sectors expected to report strong earnings.
For example:
IT moves during Q1
Banks move during Q3
FMCG moves during Q4
Earnings cycles and sector cycles often overlap and strengthen each other.
Strategy 7: Event-Driven Rotation
Based on news, policy or global events:
Crude oil rising → Energy & refining sector improves
Govt budget focus on capex → Infra & PSU rally
Rupee weakening → IT & Pharma benefit
Fed rate cuts → Financials & Realty boom
Events accelerate sector rotation speed.
Common Mistakes in Sector Rotation Trading
1. Entering After the Rally Is Over
If a sector has already given:
20–30% weekly move
4–5 months leadership
It may soon rotate out.
2. Ignoring Macro Signals
Traders who only watch charts miss the bigger picture. Macro trends drive rotations.
3. Chasing Too Many Sectors
Focus on 2–3 sectors at a time. Too many sectors dilute capital and attention.
4. Confusing Short-Term Noise With Rotation
Rotation is visible on weekly time frames, not intraday.
Benefits of Sector Rotation
Helps avoid underperforming areas
Aligns with institutional money
Reduces risk as you stay with strong sectors
Improves probability of capturing long-swing trends
Eliminates guesswork in stock picking
Provides a structured approach
In short: sector rotation keeps you on the right side of the market.
Final Thoughts
Sector rotation is not a prediction strategy—it is an observation strategy. You observe where money is flowing and position yourself accordingly. In Indian markets, sector leadership changes every 3–12 months, creating repeated opportunities for informed traders. By combining macro analysis, volume profile, price action, and ratio charts, you can build a robust rotation-based trading framework that works across market cycles.
Hedging with GoldWhy Gold Works as a Hedge
Gold’s hedging power comes from a few fundamental characteristics that have not changed for hundreds of years:
Limited Supply – Gold cannot be printed like currency. Central banks cannot create gold, so its value is less influenced by inflationary policies.
Universal Acceptance – Every country accepts gold as real value. It works beyond borders, politics, and currency systems.
Safe-Haven Asset – When global markets face uncertainty—war, recession, market crashes—investors run towards gold.
Anti-Inflation Characteristics – When inflation rises, the purchasing power of money falls, but gold usually appreciates.
Low Correlation with Equity Markets – When equities fall, gold often stabilizes or rises, making it a natural hedge.
These traits make gold a protective shield in a diversified investment or trading portfolio.
Types of Risks You Can Hedge Using Gold
1. Hedging Against Inflation
Inflation erodes the value of currency over time. Historically, gold prices rise when inflation goes up because currencies weaken.
Example: If inflation in India rises due to rising oil prices or currency depreciation, gold prices often rise in INR.
Investors use gold to preserve their purchasing power.
2. Hedging Against Currency Risk
Gold is priced globally in USD. For countries like India, gold becomes expensive when:
USD strengthens
INR weakens
Thus, gold acts as a hedge against domestic currency depreciation.
3. Hedging Against Equity Market Volatility
When stock markets fall sharply, gold generally rises or stays stable. This negative correlation helps protect portfolios.
Example: During global shocks like lockdowns, wars, or economic crises, investors move from risky assets to gold.
4. Hedging Against Geopolitical Risk
Gold reacts instantly to geopolitical uncertainty such as:
War threats
Diplomatic tensions
Oil supply disruptions
Global sanctions
When these events surface, gold becomes a safe refuge.
5. Hedging Systemic and Financial Risks
Gold holds value even when:
Banks collapse
Bond yields spike
Cryptocurrencies crash
Interest rates change
Therefore, gold is used by central banks and hedge funds as an “insurance asset.”
How to Hedge with Gold – Practical Methods
1. Physical Gold
Traditional but effective.
Gold bars
Coins
Jewellery (not efficient due to making charges)
Pros:
Tangible, no counterparty risk
Cons:
Storage, purity, liquidity issues
Best for: Long-term hedging and wealth preservation.
2. Gold ETFs (Exchange Traded Funds)
Most popular hedging tool for stock market investors.
Why they’re effective:
Easily tradable on NSE/BSE
Backed by physical gold
No storage issues
Example: Buying Gold ETF when expecting market volatility or inflationary pressure.
3. Sovereign Gold Bonds (SGBs)
Issued by RBI, these are ideal for medium-long term hedging.
Benefits:
2.5% annual interest
No storage issue
Tax-free on redemption after maturity
SGBs hedge inflation and currency risks while earning returns.
4. Gold Futures (MCX)
For traders, MCX gold futures are the most flexible hedge.
Uses:
Hedge short-term trading volatility
Lock buying/selling prices
Protect equity positions
Example:
If you are long in equities and expect a global shock, you can hedge by buying gold futures.
5. Gold Options
Options on gold, available on MCX, allow hedging using limited risk.
Example:
Buy Call option on gold → hedge against rising inflation/geopolitical risk
Buy Put option on gold → hedge against falling gold prices
Portfolio Hedging Strategies Using Gold
1. 10–15% Allocation Strategy
Most global experts recommend allocating 10% to 15% of a portfolio to gold to hedge against macro-economic risks.
Stable long-term return
Smoothens volatility
Acts as insurance during market crashes
Example allocation:
70% equity + 20% debt + 10% gold
2. Hedge When VIX Spikes
When volatility index (India VIX) rises sharply:
Markets become unstable
Investors flee to safety
Gold absorbs fear-driven flows
Traders use gold futures/options during VIX spikes to protect equity positions.
3. Dollar-Cost Averaging (DCA) in Gold
Instead of buying gold at once, accumulate slowly.
Reduces timing risk
Works during inflation cycles
Smoothens price fluctuations
Ideal for ETFs or SGBs.
4. Gold as a Hedge During Rate Cycle Changes
When central banks cut interest rates:
Gold rises (because opportunity cost drops)
When central banks raise rates:
Gold slows down, but still holds for hedging
Understanding rate cycles helps time your hedge better.
When You MUST Hedge with Gold
1. Rising Inflation Trend
If CPI inflation moves up consistently, gold becomes essential.
2. Weakening Rupee
When INR falls beyond 83–85 levels, gold prices rise quickly in India.
3. Global Recession Fears
In recessionary conditions:
Equities fall
Bond yields drop
Investors shift to gold
4. When Oil Prices Spike
Historically, oil and gold move together during crises:
higher oil = higher inflation = higher gold
5. Major Geopolitical Tensions
Wars, sanctions, Middle-East disruptions, or supply chain risks push gold higher.
Advantages of Gold as a Hedge
✔ Consistent Performance across decades
✔ Liquidity – easily traded
✔ Crisis-proof asset
✔ Acts as insurance for portfolios
✔ Balances equity risk
✔ Low correlation with other asset classes
✔ Effective against inflation and currency depreciation
Limitations of Hedging with Gold
⚠ No dividends or corporate earnings
⚠ Gold can go sideways for long periods
⚠ Short-term volatility exists
⚠ Futures require margin and skill
Gold is best used as a hedge, not as the only investment.
Conclusion
Hedging with gold is one of the oldest and most reliable risk-management strategies in financial markets. Whether it’s inflation risk, market volatility, geopolitical uncertainty, or currency depreciation, gold acts as a protective layer around your portfolio. For traders, gold provides a negative correlation hedge during equity market turbulence. For investors, gold safeguards long-term wealth and future purchasing power. In modern markets where data, algorithms, and AI influence every price move, gold remains a timeless asset—quiet, powerful, and consistent as a hedge.
India’s Market Surge1. Strong Domestic Economic Growth
The backbone of India’s market rally is its robust and consistent economic growth. India remains the fastest-growing major economy, with GDP growth often staying in the 6–7.5% range, even when global economies struggle with recession fears.
Key factors boosting economic momentum include:
High domestic consumption (India is a consumption-driven economy)
Strong government capital expenditure, especially in infrastructure
Rising manufacturing activity, supported by PLI schemes
Improving rural demand and financial inclusion
This economy-market alignment builds investor confidence that the expansion is backed by real economic progress, not just speculative money flow.
2. Consistent FII and Strong DII Participation
In previous market cycles, India heavily depended on Foreign Institutional Investors (FIIs). But the recent surge shows the strength of domestic investors:
Domestic Institutional Investors (DIIs)
Mutual funds, SIPs, and pension funds are investing record amounts every month.
Monthly SIP inflows crossing new highs build a stable, continuous support for equities.
Foreign Institutional Investors (FIIs)
FIIs have returned strongly due to India’s improving macro stability.
Compared to China, many FIIs see India as a safer, higher-growth, long-term bet.
This dual inflow dynamic creates a powerful liquidity engine that keeps markets supported even during short-term corrections.
3. Corporate Profit Boom
One of the most underestimated drivers is India’s corporate profit cycle.
Corporate profits as a percentage of GDP have hit multi-year highs.
Banks and financials are reporting record profits due to low NPAs and higher credit growth.
Manufacturing, IT, auto, and capital goods sectors are showing both volume growth and margin improvement.
When earnings grow consistently, markets rise not just because of sentiment—but because fundamentals justify higher valuations.
4. Government’s Long-Term Policy Stability
Policy continuity has played a major role in boosting investor confidence.
Important policy drivers:
GST stabilizing over time
Digitization and UPI-driven fintech boom
PLI schemes encouraging manufacturing expansion
Infrastructure push: roads, railways, logistics corridors
Make-in-India & Atmanirbhar Bharat initiatives
Clear, predictable policy frameworks attract both domestic and global investors who prefer stable emerging markets.
5. India’s Rising Global Preference vs China
A major geopolitical shift is happening:
Global investors are rebalancing away from China and moving to India.
Reasons include:
Better political stability
Fewer regulatory uncertainties
High-quality corporate governance
Massive demographic advantage
A growing middle-class consumption engine
India is being viewed as the next global growth leader, not just an emerging market. This perception shift alone adds premium valuations to Indian equities.
6. Middle-Class Expansion and Financialization of Savings
India’s middle class is growing rapidly, and with it, the financialization trend:
More people opening Demat accounts
SIP participation rising steadily
Increasing awareness of equity markets
Young investors entering trading and investing
This broad-based participation provides long-term depth and resilience to the markets—even during global volatility.
7. Sectoral Supercycles Fueling the Rally
Several sectors are experiencing their own mini supercycles:
a) Banking & Financials
Strong credit growth
Lower NPAs
Improved capital adequacy
Better provisioning
b) Capital Goods & Infrastructure
High order books
Massive government capex
Private capex revival
c) Auto & EV-related industries
Strong sales across passenger/2-wheeler/commercial vehicles
EV ecosystem development
d) Defence & PSU Stocks
Higher orders
Strategic focus on self-reliance
Market sentiment turning positive towards PSUs
e) New-Age & Tech Companies
Improved profitability
Better cash flows
More mature valuations
This multi-sector momentum gives the market a broader base, making the rally durable.
8. Stability in Inflation and Interest Rates
India has managed to maintain relatively stable inflation compared to many countries hit by energy crises, geopolitical tensions, or currency volatility.
RBI’s strict monetary policy helped keep inflation in control.
Rupee stability protects India from imported inflation.
Lower commodity prices benefit India’s manufacturing base.
Stable inflation and controlled borrowing costs help companies expand without pressure on margins.
9. Strong Global Positioning and Favourable Demographics
India’s demographic advantages will drive its markets for decades:
Average age around 29 years
Growing skilled workforce
Urbanization increasing yearly
Digital adoption growing at the fastest pace worldwide
Investors see India as a long-term compounding story rather than a short-term trade.
10. The Sentiment Factor: Confidence is at a Multi-Year High
Market cycles are also influenced by emotions—fear, greed, confidence, uncertainty.
Right now, India is riding on:
High confidence in government
Strong consumer sentiment
Optimistic business outlook
Healthy global reputation
This sentiment acts as the fuel that keeps the rally alive even during global shocks.
Is the Surge Sustainable?
While short corrections will always come, the long-term structure of India’s market rally remains strong due to:
Strong macroeconomic foundation
Corporate earnings visibility
Global capital preference
Domestic investor strength
Multi-sector growth
However, investors should be aware of valuations, especially in midcaps and smallcaps, which may see periodic cooling-off phases.
Conclusion
India’s market surge is not a temporary excitement—it is the result of strong fundamentals, stable policies, global shifts, and rising domestic participation. As the country transitions into a global economic powerhouse, its stock markets are reflecting this journey through steady, multi-layered growth. The next decade is expected to be one of the most promising periods for Indian equities, supported by structural transformation, digitization, manufacturing expansion, and a confident investor base.

AI Trading Secrets and the Indian Psychology Trading Era1. The Rise of AI Trading: Invisible Machines Behind Every Move
AI trading refers to the use of machine learning models, predictive algorithms, neural networks, and automation to make trading decisions. These systems process data far beyond human capability — from price movements and volatility to sentiment and macro signals. The real secret of AI trading is that it doesn’t just “see data”; it learns from historical patterns and adapts to real-time conditions.
AI Trading Secret #1: Feature Engineering Is More Important Than Models
Most people think AI magic lies in fancy models. But in reality, the quality of input data (“features”) determines how good the prediction is. Smart AI traders know how to extract features like:
Volume clusters
Volatility squeeze signals
Order book buildup
High-frequency momentum micro-patterns
These allow AI systems to predict not the “future market”, but the probability of short-term moves.
AI Trading Secret #2: AI Does Not Predict — It Works on Probability Mapping
AI systems calculate probability zones. For example:
68% probability: NIFTY may stay within a certain band
55% probability: a breakout may occur
72% probability: volume expansion confirms momentum
This probabilistic thinking makes AI far more disciplined and emotion-free compared to human traders.
AI Trading Secret #3: Alternative Data Is the True Edge
Modern AI traders are not limited to charts. They read “unseen data,” including:
Social media sentiment
Google Trends
WhatsApp retail buzz
FII/DII trading micro-behaviour
Global ETF flow patterns
Options chain clustering
This alternative data gives AI a big advantage — early detection of shifts that humans take hours or days to notice.
AI Trading Secret #4: Automation Protects You From Human Weakness
AI never:
Overtrades
Gets greedy
Averages blindly
Seeks revenge trades
Breaks rules
This discipline alone gives AI traders a massive edge.
AI Trading Secret #5: AI’s Final Power — Backtesting + Optimization
AI systems test thousands of scenarios:
Different stop losses
Different entries/exits
Different indicators
Different position sizing rules
This creates strategies that are mathematically optimized rather than emotionally guessed.
2. Indian Psychology Trading Era: A New Mindset Born After 2020
India has seen a trading revolution after COVID. Nearly 10+ crore retail traders entered the market. But what makes Indian trading psychology unique?
2A. India’s Retail Trader Behaviour: Emotional Yet Evolving
Indian traders historically operated on:
Tips
WhatsApp calls
Penny stocks
Rumours
Overconfidence
But after 2020, a shift began — more awareness, YouTube learning, Algo tools, and community learning transformed the mindset.
Psychology Trend #1: Hope-Based Trading to Data-Based Trading
Earlier:
People traded based on “feeling Nifty will go up.”
Now:
People analyse:
OI data
PCR
Volume profile
Institutional flow
This marks the birth of the Indian Data-Driven Retail Era.
Psychology Trend #2: From Heroic Trading to Systematic Trading
Earlier:
“Bhai, full margin laga do, kal upper circuit jayega!”
Now:
Traders prefer:
Swing + risk-reward
Stop-loss
Algo automation
Hedged option strategies
The ego of “catching tops and bottoms” is slowly dying.
Psychology Trend #3: Options Mania Changed Behaviour
Indians love leverage. Options gave them:
Low capital
High ROI possibility
Fast trading cycles
This created both growth and chaos. But now traders are learning:
Sell-side edges
Premium decay
IV crush
Weekly expiry psychology
This learning curve is transforming the Indian retail community into a more sophisticated force.
3. Blending AI With Indian Psychology: The New Era of Smart Retail
This is where the magic happens. When AI meets Indian trading psychology, three powerful shifts occur:
Shift #1: AI Reduces Emotional Mistakes of Indian Traders
Indian traders struggle with:
Fear of missing out (FOMO)
Holding losers
Exiting winners early
Overtrading for “thrill”
AI solves these with:
Rule-based systems
Automatic execution
Pre-fixed risk management
Objective signals
Disciplined execution removes 80% emotional damage.
Shift #2: Indian Traders Bring Intuition AI Cannot See
AI understands data, but not “political sentiment,” budget buzz, or Indian-style retail behaviour. Indian traders understand:
Election season moves
Dubbed “operator activity”
Midcap burst cycles
Sectoral rotations
Market mood swings
This intuition plus AI’s objectivity creates the perfect trading duo.
Shift #3: The Rise of Hybrid Systems in India
This is the future:
A blend of human analysis + AI execution.
Example workflow:
Trader analyses volume profile + market structure
AI system generates probability zones
Human selects scenario
AI trades automatically
This hybrid edge will dominate the Indian markets in coming years.
4. Biggest Psychological Barriers Indian Traders Must Break
To fully enter the AI + psychology era, Indian traders must overcome:
Barrier 1: Overconfidence Bias
Thinking “I know the market” instead of “market can do anything.”
Barrier 2: Tip Addiction
Relying on outside voices instead of system-based confidence.
Barrier 3: Quick-Rich Fantasy
Expecting to make 50,000/day with 10,000 capital.
Barrier 4: Revenge Trading
Trying to “win back” lost money emotionally.
Barrier 5: Impulse Trading
Taking a trade because the candle “looked good.”
AI erases most of these — if traders let the system work.
5. What the Future Looks Like
India is entering a very powerful trading era:
AI will handle execution
Humans will handle market structure
Psychology will be increasingly coded into systems
More retail traders will use algos
Market will become more competitive
Only disciplined + data-driven traders will survive
The ones who stay in the game the longest will be those who embrace AI discipline + Indian intuition.

classic example of Ending Diognal Triangle in MRF Dear Trader this is classic case of ending diagonal triangle
this is daily chart of MRF starting from 5th march to 26th may 2025 is five wave which is the third wave and after than up to 4th June 2025 is 4th wave and after that it move up in to three wave which is indicating that this is diagonals triangle
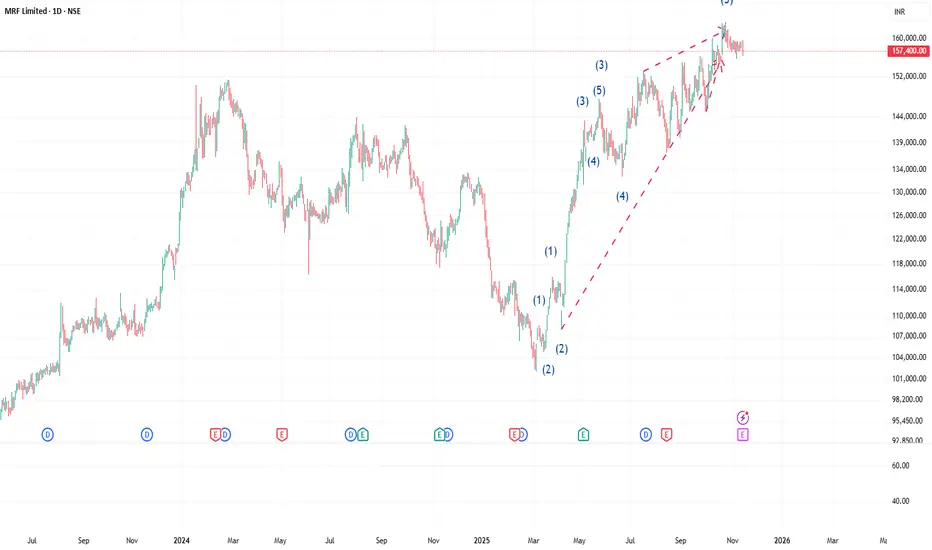
Divergence Secrets What Are Options?
An option is a financial contract that gives the buyer the right, but not the obligation, to buy or sell an underlying asset at a fixed price (called the strike price) on or before a certain date (called expiry). There are two types of options:
Call Option – gives the right to buy.
Put Option – gives the right to sell.
The person who buys an option pays a fee known as the premium. The seller (also called the option writer) receives this premium and has the obligation to carry out the contract if the buyer chooses to exercise it.

Part 1 Intraday Trading Master ClassWho Wins More—Option Buyers or Sellers?
Option buyers have limited risk and unlimited reward, but their probability of success is lower because:
Time decay works against them.
They need strong directional movement within a short time.
Option sellers (writers) have limited profit but higher probability of winning because:
Time decay works in their favor.
Markets stay range-bound more often than they trend strongly.
Thus, professional traders often prefer option selling strategies like:
Iron condor
Straddle
Strangle
Credit spreads
Covered calls
Retail traders, on the other hand, prefer buying options due to lower capital requirements.
